Thank you to everyone who has contributed in past years!
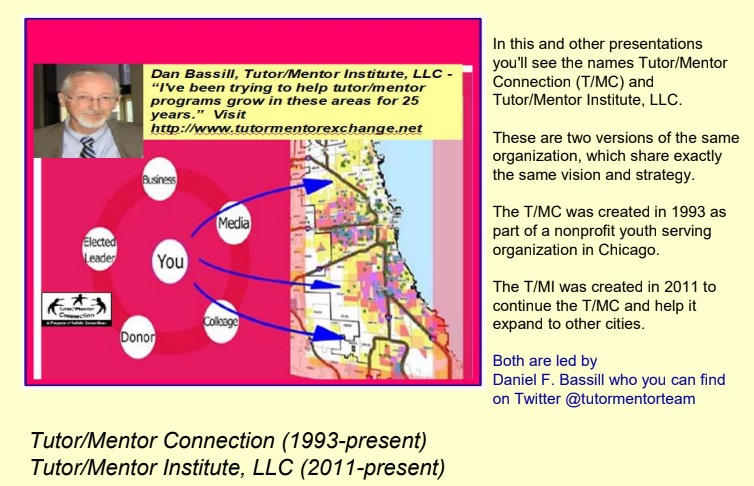
I started the Tutor/Mentor Connection in 1993 and the Tutor/Mentor Institute, LLC in 2011.
Please contribute to help me continue. (scroll down to bottom of this page to find PayPal button and/or mailing address) This entire website is full of reasons for helping me help volunteer-based tutor, mentor and learning programs grow in every area of persistent poverty. It's also a resource for any type of problem-solving!
The image shown above is from a visual essay titled "Tipping Points".
It visualizes the strategies that I'm sharing and that I ask you to support with your contributions and by sharing my posts.
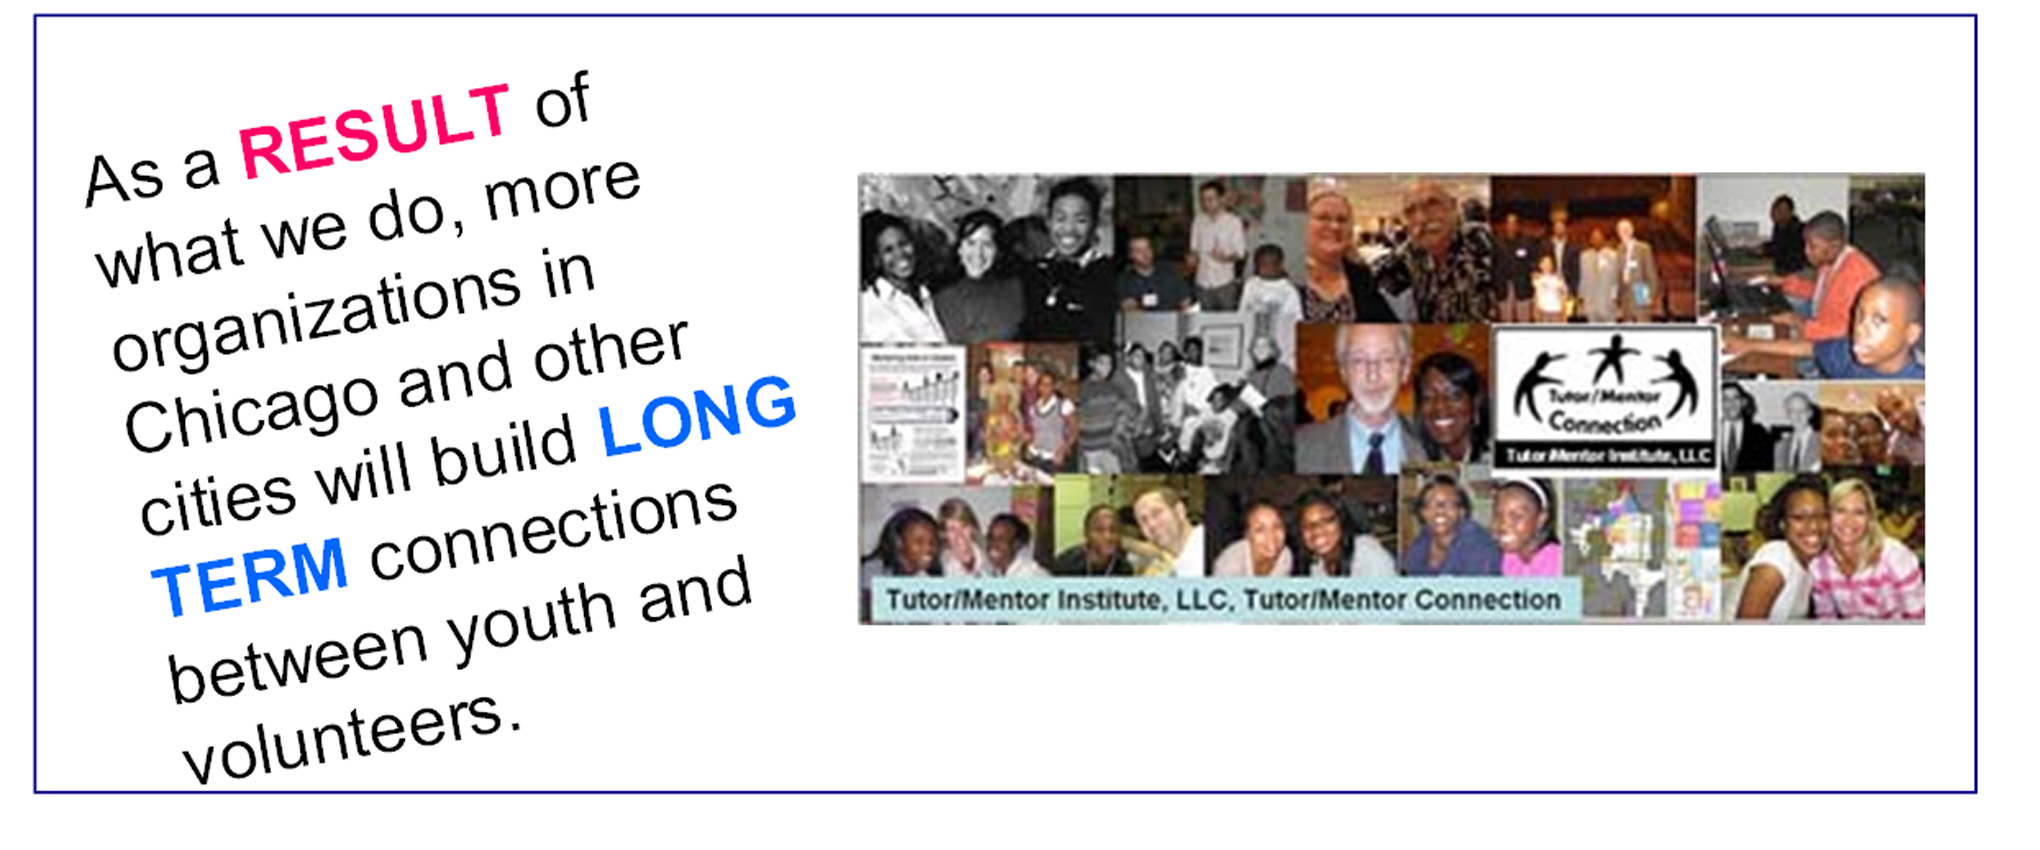
Rather than trying to be a single leader in a huge city, the T/MC, and now T/MI, have sought to provide an information platform that all leaders can use to LEARN, EDUCATE, and INNOVATE ways to support long-term, mentor rich, volunteer-based tutor, mentor and learning program growth in more places and to solve other complex social, political and environmental problems facing this country and the world.
With your help, I can continue.
If someone you know has become ill and needs money to pay bills, they set up a "Go Fund Me" page and ask for contributions. So, this is my "fund me" page. I (Daniel Bassill) have been self-funding most of this work since 2011, supported by a small group of continuing donors.
Please send a contribution of $25, $50, $100, $250, $500 or more to help me continue in 2026 and beyond.
Mail contributions to:
Tutor/Mentor Institute, LLC
c/o Daniel Bassill
932 N. Salem Avenue
Arlington Heights, IL 60005
Thank you for helping me help others.
Note. The Tutor/Mentor Institute, LLC is not a 501-c-3 non profit, so your contributions are not tax deductible. They will be used to support social benefit and the lives of thousands of young people born and living in high poverty areas of Chicago and other places.