"AND? IT'S ALL CONNECTED," - A SYSTEMS THINKING APPROACH
click here
This site is described as "a work under development presenting my (Gene Bellinger's) current understanding which has evolved from my four decade journey from systems thinker to storyteller."
If you're interested in solving complex problems visit this link then read through the pages. Purchase a subscription if you choose, but it's not required to build an understanding. You need a password to log in and view.
A 2025 UPDATE OF GENE BELLINGER'S SYSTEMS THINKING LIBRARY
click here
This site is related to the "And, It's all Connected" site. It is named "Gene's 2nd Brain" which is (as he says) "where I attempt to organize everything I touch that seems meaningful. Well, at least to me." This site uses an interactive concept mapping/visualization tool to organize hundreds, if not thousands, of links. Spend some time becoming familiar with it. Re-visit often. Create your own version. No password needed.
A BETTER WORLD BY DESIGN
http://betterworldxdesign.com/about.html
From the web site: "Each year, Better World by Design brings a global community of innovators to Providence, Rhode Island to reach across disciplines and unite under a common goal: building a better world. Presenters share engaging stories, workshops teach creative skills, and discussions re-frame perspectives. Better World is an immersive experience that deepens our understanding of the power of design, technology, and enterprise to engage our communities and sustain our environment."
A BLOG THAT COMMUNICATES VISUAL THINKING IDEAS
https://darmano.typepad.com/logic_emotion/visual-thinking-synthesis.html
This site provides a lot of ideas and information for why and how people can integrate visualization into their thinking and communications. These are concepts the Tutor/Mentor Connection seeks to incorporate into its efforts
A COLLECTION OF KUMU SYSTEMS THINKING PROJECTS
https://blog.kumu.io/introducing-projects-in-the-wild-5528050de844
https://kumu.io/kumu/projects-in-the-wild
https://www.linkedin.com/company/kumu/posts/
This blog article is titled "Projects in the Wild" and hosts a growing list of projects that use KUMU to "design simple, thoughtful solutions that help us work in complexity". This should be a great resource for any who are using KUMU or any form of concept mapping tools, or who are trying to solve complex problems. I've also been adding links to new Kumu projects to this article on the Tutor/Mentor blog. In addition, I've created a concept map that points to many data visualization resources.
ACTION PLANNING FOR TEACHERS (AND MENTORS)
http://www.nefstem.org/teacher_guide/prep/index.htm
From the web site: "This guide for classroom action research was created by teachers for teachers. The resources here were designed to support reflective and systematic improvement of teaching. Use the tabs at the top of each page on this web site to explore the stages of action research. The planning steps are outlined visually, and can be used by leaders of volunteer-based tutor/mentor programs as well as by teachers in traditional public schools."
AID TO NETWORKS - MONITOR INSTITUTE BY DELOITTE
https://www2.deloitte.com/us/en/blog/monitor-institute-blog.html?icid=nav2_social-innovation-blog
From the web site: "Monitor Institute by Deloitte works with social impact leaders to help surface and pioneer "next" practices—breakthrough approaches for societal challenges. As part of Monitor Group and now at Deloitte LLP, the team has catalyzed progress on some of the pressing issues of our time."
AMBIGUITY - ORGANIZING THOUGHTS USING X-MIND AI
https://dougbelshaw.com/blog/2025/11/22/organising-ambiguity/
https://app.xmind.com/share/Qh213vkj?xid=qUPrCvKU
https://xmind.com/ai
Here's a blog article titled "Organizing some thoughts around ambiguity" in which the author shares a concept map created using X-Mind AI. Add this to your tool box for mind mapping and concept mapping.
AN INFORMATION VISUALIZATION CLASS - WHAT TO LEARN
https://ella.sice.indiana.edu/~katy/S637-S08/
This link is to the 2008 Information Visualization course being taught by Dr. Katy Börner at the University of Indiana. It provides a detailed outline of the learning, with numerous links to on-line resources, that her class will go through to build expertise in this area.
AN OVERVIEW OF CURRENT SOCIAL MEDIA RESEARCH TOOLS
https://blogs.lse.ac.uk/impactofsocialsciences/2015/07/10/social-media-research-tools-overview/
In this article, "Wasim Ahmed presents a quick look at some of the tools available to social scientists for analysing social media data and also reflects on the limitations of the platforms and the methods used for this type of research."
APPLY SYSTEMS THINKING IN STRATEGIC PLANNING
http://hainescentre.com/rollercoaster/
This is one of many articles available on the web site of the Haines Centre for Strategic Management®.
APPRECIATIVE INQUIRY COMMUNITY INTERNATIONAL
https://www.facebook.com/groups/AICInternational/
Appreciative Inquiry Community International is a Facebook group that will "connect, share, combine and co-develop the practices based on Appreciative Inquiry and other strength based practices and aim to spread these practices."
BETWEEN FRIENDS-THE VALUE OF THE "SOCIAL GRAPH."
https://www.technologyreview.com/2008/02/19/221950/between-friends-2/
This 2008 article from "Visual Matters" site offers some ideas describes a social graph, a representation of a person's network of friends.
BOSTON DATA COMMONS - INTEGRATES VISUALIZATIONS
https://datacommon.mapc.org/
From the web site: "The MetroBoston DataCommon provides a wealth of information about the region’s people and communities through a variety of topics -- from arts and education to the environment and transportation. A resource for all those seeking to understand how the region is changing, it helps residents, stakeholders, planners, city and town officials, educators and journalists explore data and make informed decisions. We invite you to explore its data, community snapshots and create your own visualizations and reports.
BUCKMINSTER FULLER INSTITUTE - INSPIRING AND SUPPORTING A NEW GENERATION OF AUDACIOUS DESIGN INITIATIVES
https://www.bfi.org/
From the website: "Buckminster Fuller developed the new discipline of Comprehensive Anticipatory Design Science to support a whole systems approach to "make the world work for 100% of humanity in the shortest time possible." We are expanding this work, making it available in new ways, and actively applying it to urgent global challenges."
CAMBRIDGE DOUGHNUT PROJECT - OUTLINED USING KUMU.IO
https://www.kumu.io/lstabler10/cambridge-doughnut-project-plan-sandbox#flowchart
From the website: "This collaborative model originated with the Cambridge Doughnut Project Plan by Lauren Stabler https://kumu.io/lstabler10/cambridge-doughnut-project-plan and contributions by Brian Dowling through New Community Paradigms"
The concept map created, using Kumu.io, demonstrates a unique community engagement planning process, and the potential of concept mapping tools like Kumu.io.
CODE PEN - A SOCIAL DEVELOPMENT ENVIRONMENT FOR DEVELOPERS
https://codepen.io/
From the website: "CodePen is a social development environment for front-end designers and developers. Build and deploy a website, show off your work, build test cases to learn and debug, and find inspiration.The best place to build, test, and discover front-end code."
COLLECTING MEANINGFUL DATA ABOUT YOUR NETWORK - USING SNA
click here
This is an article that talks about using data and network analysis to understand networks. Here's the introduction: "The effectiveness of any collaborative effort — whether it’s a network or an organization — depends primarily on the strength of the connections that exist between the participants involved. Social network analysis (SNA), using mapping tools like Gephi or Kumu, is the most effective method currently available for visualizing that connectivity and for evaluating a collaboration’s effectiveness. However, SNA is only useful if it is constructed with meaningful data and applied with the “so what” in mind.
CONCEPT MAPPING. WORLDWIDE MAPS
http://www.2wmaps.com/
From the web site: "The WWMAPS project organizes cultural exchange relations and construction of structures of knowledge between students from geographically distant countries and language. The difficulties of communication and distance are both solvable through the use of concept maps, made with appropriate software and shared in a network environment. Software and network environment are both provided by CmapTools, a free program very easy to use."
CONCEPT MAPS AID KNOWLEDGE MODELING AND SHARING - CMAP TOOLS
https://cmap.ihmc.us/
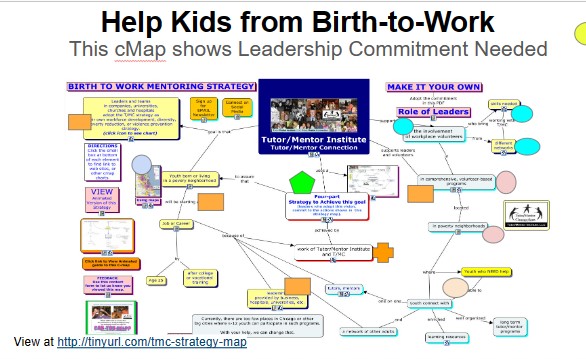
From the web site: "Concept maps are graphical tools for organizing and representing knowledge in an organized fashion. Learn what concept maps are, how to construct them, and use them." Note: The Tutor/Mentor Connection and Tutor/Mentor Institute, LLC have been using CMap tools since 2005 to visualize strategy and resources available to visitors of our web sites. We're looking for partners to help map concepts of the T/MC. See Leadership Commitment Strategy Map - http://tinyurl.com/tmc-strategy-map
CONCEPT MAPPING AND MINDMAPPING INTRODUCTION
https://www.patreon.com/posts/concept-mapping-15313656
This article by Howard Rheingold is a useful introduction to concept maps and mind mapping.
CREATE CONCEPT MAPS (OR MIND MAPS) USING ARTIFICAL INTELLIGENCE - TRY WHIMSICAL
https://whimsical.com/
The Whimsical platform offers quick, easy tools to create mind maps, concept maps, flow charts, wireframes, etc. There is a FREE starter version but then there are fees for use. This video shows an Artificial Intelligence tool that can be used in creating mind maps and concept maps. https://www.youtube.com/watch?v=IbJwXWN2SHg
CYNEFIN MODEL - LOOKING AT COMPLEX PROBLEMS
https://en.wikipedia.org/wiki/Cynefin_framework
This model of complex problem solving is one that can be applied to our efforts to surround inner city kids with learning and mentoring that leads to long-term benefits for kids, industry, and communities. This link goes to a Wikipedia definition.
DATA STORY-TELLING TOOLS - 30 BEST - 2017 ARTICLE
https://medium.com/@ToTheVictor/nicar30tools-da83db0f3dc6
This article point to tools many of us might use to tell effective stories.
DATA VISUALIZATION BY CLEVERFRANKE - EXAMPLES OF WHAT'S POSSIBLE
https://www.cleverfranke.com/
View the video on the home page to see the range of data visualization work done by this company. Visit http://www.cmap.illinois.gov/mobility/explore#/ to see website created for CMAP in Chicago.
DATA VISUALIZATION AND INTERACTIVE TOOLS ON HANYS (HEALTHCARE ASSOCIATION OF NEW YORK STATE) WEBSITE
https://www.hanys.org/data/
This section of the HANYS website shows data visualizations created to support the mission of the Healthcare Association of New York State.
DATA VISUALIZATION EXAMPLES FROM ACROSS THE WEB CREATED WITH TABLEAU PUBLIC.
https://public.tableau.com/en-us/gallery/?tab=viz-of-the-day&type=viz-of-the-day
These are examples of products created using Tableau data visualization software.
DATA VISUALIZATION EXAMPLES FROM STAMEN - 2016 WORK
click here
This article points to data visualization projects Stamen worked on in 2016 and demonstrates the wide range of ways data can be visualized.
DATAINTERFACES - FORMATS FOR DATA-RICH SCENARIOS
http://www.datainterfaces.org/category/projects/
From the web site: "DataInterfaces is a research laboatory that merges the competences of communication design, complex systems science, and computer science in the creation of interfaces betwee data and people."
DATAWRAPPER RIVER
https://app.datawrapper.de/river/faq
From the website: "The Datawrapper River is a place to exchange charts and maps with other Datawrapper users. After adding a chart to the River, anyone can use it and customize the chart in Datawrapper before publishing it on their website in their own style. The River is bridging the gap between Data-Haves and Have-Nots. Scientists, NGOs and government institutions will reach more people. And journalists will be able to find and use data with less time spent on searching, cleaning, visualizing. Ideally, the River can work like a “wire service for charts”"
DEMONSTRATION OF USE OF VISUALIZATION - CREATING A NEW PARADIGM FOR HOW WE INTERACT WITH THE PLANET'S OCEANS
https://oceanreturns.com/the-ocean-system/index.html
This presentation "Explores the interrelation between healthy markets, thriving communities and flourishing ecosystems". View the video. Look at the graphics. Read the descriptions. Then explore the Kumu.io map.
DEMONSTRATION OF USE OF CONCEPT MAPS
http://www.nwlink.com/~donclark/about/conceptmap.html
This site is one of the largest non-commercial training and development sites on the web. In this section the site uses a concept map to help visitors navigate the information on the site.
EDUCATION AROUND THE WORLD - GREAT WEBSITE
http://visualdata.dw.com/specials/bildung/en/enrollment.html
This site includes graphs and interactive charts that offer insight into the rates of literacy among men and women in various regions around the globe and examines school enrollment and educational expenditures in individual countries. Nearly all of the data is based on statistics collected by UNESCO. Excellent example of uses of visualization technologies.
E-LEARNING TUTORAL ON VISUALIZATIATION
https://www.visual-literacy.org/
From the web site: "This e-learning site focuses on a critical, but often neglected skill for business, communication, and engineering students, namely visual literacy, or the ability to evaluate, apply, or create conceptual visual representations. After this tutorial, students should be able to evaluate advantages and disadvantages of visual representations, to improve their shortcomings, to use them to create and communicate knowledge, or to devise new ways of representing insights.
EVERY SINGLE COGNITIVE BIAS IN ONE INFOGRAPHIC
https://www.visualcapitalist.com/every-single-cognitive-bias/
This is just one of many infograpics on this site. Take a look.
EVIDENCE SHOWING VALUE OF VISUAL PORTFOLIO MAPPING
https://www.visualcapitalist.com/every-single-cognitive-bias/#mce_temp_url#
This article shows research done that provides "empirical evidence that visualization directly and positively impacts business outcomes."
EXAMPLES OF DATA VISUALIZATION FROM 2012 GLOBAL VOICES CITIZEN MEDIA SUMMIT
https://summit2012.globalvoices.org/2012/07/visualizing-data-at-global-voices/
This blog and the audio provide many ideas for using visualization of data to share ideas.
GAPMINDER PROVIDES FACTS ABOUT WHAT'S HAPPENING IN WORLD
https://www.gapminder.org/tools/#$chart-type=bubbles&url=v1
From the website: "Gapminder is an independent Swedish foundation with no political, religious or economic affiliations. Gapminder is a fact tank, not a think tank. Gapminder fights devastating misconceptions about global development. Gapminder produces free teaching resources making the world understandable based on reliable statistics. Gapminder promotes a fact-based worldview everyone can understand." The website has a huge library of information that is visually shared. Take time to get familiar with it.
GENETIC ATLAS OF HUMAN ADMIXTURE HISTORY - MAPPED USING GOOGLE MAPS
https://www.gapminder.org/tools/#$chart-type=bubbles&url=v1
This map demonstrates a creative use of GIS mapping and data visualization. It shows research done to understand human DNA and its history, and how humans have spread around the globe over the past 4000 years. See related article in NY Times.
GLOBAL FUTURES SOCIETY NETWORK MAP - MADE USING KUMU.IO
https://www.dubaifuture.ae/global-futures-society
https://kumu.io/gfs/gfs-mapping#gfs-map
From the website: "The Global Futures Society (GFS) Network Map is a strategic tool designed to visually represent the member organisations, and individual members in addition to the relationships between them. In a field as diverse and dynamic as foresight, it can be challenging to track ongoing projects, partnerships, and initiatives. The GFS Network Map addresses this by offering a clear, interactive view of how the membership are connected, what they're focused on, and how their efforts contribute to shaping the future."
GLOBAL PRIORITIES FLOW CHART - HOW TO GET INVOLVED?
http://globalprioritiesproject.org/2015/09/flowhart/
Want to make a difference in the world? Where to start? This flow chart offers a lot of ideas to consider.
HOW SYSTEMS MAPPING CAN HELP YOU BUILD A BETTER THEORY OF CHANGE
https://blog.kumu.io/how-systems-mapping-can-help-you-build-a-better-theory-of-change-4c85ae4301a8
Applying systems thinking and concept mapping to planning process and to communicating your theory of change is the focus of this article.
IDEA MAPPING SUCCESS
http://ideamappingsuccess.com/
From the web site: "Idea Mapping is a powerful whole-brained visual thinking tool that enhances memory, note-taking skills, thought organization, planning, creativity, and communication. It uses color, keywords, lines and images to connect thoughts associatively. Idea Maps are the natural expression of the way the brain processes information associatively. (See more examples on this site and many more on the Idea Mapping Blog)"
INTERACTIVE PRESENTATION - SYSTEMS THINKING + YOUTH UNEMPLOYMENT IN BOTSWANA
https://piercegordon1.kumu.io/system-thinking-youth-unemployment-in-botswana
This presentation uses the Kumu.io software to create an interactive visual presentation showing challenges facing young people in Botswana as they try to find employment.
INTERACTIVE SYSTEMS THINKING - YOUTH EMPOYMENT MAP - SHOWING BARRIERS AND OPPORTUNITIES FOR YOUNG PEOPLE IN ENGLAND
https://youthfuturesfoundation.org/our-work/identify/youth-employment-system-map/
This interactive casual loop diagram map was created by the Youth Futures Foundation in 2021 to map the youth employment system in England. From the website: "It provides a visual representation of the barriers and opportunities young people from marginalised backgrounds face as they seek good jobs."
INTERNATIONAL NETWORK FOR SOCIAL NETWORK ANALYSIS
https://www.insna.org/
This is a web site for researchers interested in social network analysis (SNA). We can learn much about SNA by browsing the various sections of this site.
KNOWLEDGE VISUALIZATION
http://knowledgevisualization.blogspot.com/
This blog show some interesting visualizations with links to other web sites. Last updated in 2006. Articles still relevant.
KNOW-WHY-NET IMODELER - VISUALIZATION AND ANALYSIS OF INTERCONNECTIONS
https://www.know-why.net/
From the web site. "KNOW-WHY.NET is an international platform for sharing models from different fields. The models are developed and presented using the iMODELER, which is arguably one of the leading tools available for the visualization and analysis of interconnections. The basic iMODELER is free, but there is also a more powerful paid full version available. The models can be explored directly in your browser."
KUMU - A POWERFUL CLOUD-BASED VISUALIZATION PLATFORM
https://kumu.io/tour
Kumu is a powerful, flexible concept mapping platform, capable of mapping complexity of all kinds. Visit the website to learn about all the features. Join the FREE Kumu community.
LANDSCAPE OF CONSCIOUNESS INTERACTIVE VISUALIZATION
https://loc.closertotruth.com/interactive
From the website: "This 4-map interactive visualizes theories of consciouness, showing category, scholarly/scientific interests, complexity, and connections with one another. It's valuable if this is a topic you're interested in and as a demonstration of what's possible using interactive visualization tools."
LITTLESIS - A TOOL FOR MAPPING POWER RELATIONSHIPS
https://littlesis.org/toolkit/
https://littlesis.org/resources/
From the website: "LittleSis is a free, open-source research platform. It is a database of who-knows-who at the heights of business and government and a p owerful tool for strategic research. This toolkit has been designed to provide people with the tools to conduct power research and develop a research pod, or crew of folks, that have the skills to investigate local corporate bodies and organize against them. You can use this toolkit as a starting point for organizing around a common target with your neighbors and friends,or to strengthen the work of your organization."
MARCELIO: REVOLUTIONIZING SCIENTIFIC INFORMATION MANAGEMENT
https://doi.org/10.5281/zenodo.17525893
https://kumu.io/craisistemas/mapa-interactivo-micelio
These links point to a data visualization created by a team at the José Simeón Cañas University of Central America (UCA) using KUMU, and to a report introducing Micelio, described as "the implementation of the first DSpace-CRIS in El Salvador. If you know of other universities in the world with this type of information managment system please share your links on LinkedIn.
MAPPING COMPLEXITY USING KUMU
https://csl4d.wordpress.com/2014/06/25/wicked-solutions-major-influences/
This 2014 article titled "Wicked Solutions: Major Influences" offers tips for using KUMU to map complex relationships. The KUMU platform has made many enhancements since then.
MAPPING COMPLEXITY USING KUMU - SEE LINKS IN TUTOR/MENTOR BLOG ARTICLES
https://tutormentor.blogspot.com/search/label/Kumu
Some of the articles posted on the Tutor/Mentor blog have updates at the bottom, with new links found after the original article was posted. This link points to articles about KUMU and other concept mapping tools.
MAPPING WICKED PROBLEMS - BLOG
https://www.wicked7.org/category/wicked-problem/
This website has many blog articles that use concept maps to visualize ultra complex problems. Most focus on questions like "What are the most urgent issues facing society? How did we get there? What are the root causes? What must be done now?".
MIND MAPS USED FOR BIBLE STUDY - BLOG
http://petrabthg.blogspot.com/2011/12/effective-bible-study-with-mind-mapping.html
Browse through articles on this blog and see how concept maps/mind maps are used to outline passages in the Bible and create deeper understanding. Hope to find people in faith communities using mind maps to visualize strategies for helping the poor climb out of poverty.
NATIONAL NEIGHBORHOOD INDICATORS PROJECT
https://www.neighborhoodindicators.org/activities/issues
From the web site: "The National Neighborhood Indicators Partnership (NNIP) works to build local capacity, plans joint activities, and works in conjunction with affiliated organizations.
In recent years all NNIP partners have built advanced information systems with integrated and recurrently updated information on neighborhood conditions in their cities. Creation of this capacity, which did not exist in any U.S. city two decades ago, represents an important technical and institutional breakthrough."
NETWORK MAPPING - OPTIMICE.COM
https://www.optimice.com.au/
This site illustrates a way to map who you're connected with and provides many other ideas on social network analysis.
NETWORK VISUALIZATION TOOLS - ARTICLE BY DR. VERONICA ESPINOZA
https://medium.com/@vespinozag/16-network-visualization-tools-that-you-should-know-2c26957b707e
This article provides a brief description of 16 network visualization tools, and includes a story to demonstrate how each can be used.
NETWORK WEAVING TOOLS USER GROUP
https://q.health.org.uk/get-involved/events/network-weaving-tools-users-group-meet-up
This UK based platform supports sharing of ideas about meeting-focused tools created by the Network Weaving online group. This is one of an on-going series of ZOOM meetings hosted by this group.
OPEN INDICATORS CONSORTIUM (OIC) - ARCHIVE
https://www.neighborhoodindicators.org/activities/projects/open-indicators-consortium-weave
From the web site: "The Open Indicators Consortium (OIC), which operated from 2008 to 2014, was founded by partners from across the United States who came together to support and guide the development of the Weave software and its application as a high-performance open source data analysis and visualization platform free to all. The consortium’s goal was to transform publicly available data into visually compelling and actionable indicators to inform public policy and community-based decision makers. An independent firm took over the development of the software in 2016.
ORGNET - SOCIAL NETWORK ANALYSIS SOFTWARE AND SERVICES
http://www.orgnet.com/about.html
From the web site: "Valdis Krebs, Founder and Chief Scientist, at Orgnet, LLC is a management consultant, researcher, trainer, author, and the developer of InFlow software for social & organizational network analysis." This site provides a wealth of understanding about concepts of social network analysis, as well as services that can be purchased for doing this work.
PARTICIPATORY COMMUNITY MAPPING AS COLLECTIVE SENSEMAKING - 5 PART INTERVIEW W ALDO De MOOR
https://greaterthanthesum.com/aldo1
https://greaterthanthesum.com/aldo5/
This set of articles on the Greater than the Sum website, provide valuable insight into participatory mapping as a crucial methodology for social intervention. My link points to the 5th article in the series, and to the first.
PARTNER- TOOLS TO ASSESS PARTNERSHIPS/COLLABORATION
Greater than the Sum - first article/
From the web site: "PARTNER is a social network analysis tool designed to measure and monitor collaboration among people/organizations. The tool is designed for use by collaboratives/coalitions to demonstrate how members are connected, how resources are leveraged and exchanged, the levels of trust, and to link outcomes to the process of collaboration."
PLANET SCHOOL - MIND MAPPING VISUALIZATION
https://www.mindmeister.com/106237621/planet-school-the-idea/
This mind map was used to describe the Planet School strategy.
POWER MAPPING - LEARN TO USE CONCEPT MAPS TO IDENTIFY WHO HAS THE POWER TO FIX THE PROBLEM YOU WANT FIXED.
https://commonslibrary.org/power-mapping-to-design-a-winning-campaign-strategy/
This is an article from The Commons Social Change Library. It describes a powerful planning and visualization skill, which it called "power mapping". The article recommends, "Use it to figure out who has the most influence over the issue you are focused on and who is most likely to give you what you want." This is a skill Tutor/Mentor Connection (1993-present) and Tutor/Mentor Institute, LLC (2011-present) have tried to master for many years. Here's one article from our blog. https://tutormentor.blogspot.com/2025/03/mapping-ideas-information-and-networks.html
PREZI - ENGAGE YOUR AUDIENCE. BLOG ARTICLE
https://peterpappas.com/2009/02/prezi-engage-your-audience-with-a-zooming-nonlineal-presentation.html
This blog article describes a web based collaboration and visualization tool called Prezi.
Note: Visit this page to see how interns use Prezi to share Tutor/Mentor Institute, LLC ideas. http://www.tutormentorexchange.net/definition-of-issues/ideasanimation/intern-strategies
PROJECT 990 IS BUILDING COMPREHENSIVE DATA ANALYTICS PLATFORM TO SUPPORT THE NONPROFIT SECTOR, POLICYMAKERS AND THE PUBLIC
https://project990.org/
https://public.tableau.com/app/profile/fulton/vizzes
https://www.linkedin.com/company/smartcharityai/
Visit this site to learn how Project 990 is "building a comprehensive data analytics platform that integrates information from millions of tax filings, grants, and other sources related to philanthropic giving." See how Project 990 is visualizing the funding flow across the nonprofit sector. See examples of their work on the Smart Charity LinkedIn page and on this Tableau website.
REDESIGN NETWORK - DESIGNDIALOGUES
https://designdialogues.com/design-business-as-agents-of-world-benefit/
From the website: "The Redesign Network works internationally across a wide community of great people. We create successful and enduring information resources for complex practices and work. Redesign advocates systemic design for practice and services, based on understanding the patterns and meaning of human activity. adapting innovative methods from interpretive and empirical traditions."
ROOT CAUSE OF POVERTY - SOME RECOMMENDED READING
http://tutormentor.blogspot.com/2012/04/increase-in-homicides-what-is-root.html
In this Tutor/Mentor Institute, LLC blog article I've aggregated some links to articles showing "root cause analysis" and thinking. If we can understand the basic causes that lead to acts of urban violence and to kids under-performing in school and life we might have a better chance of mobilizing resources to remove these causes.
SERVICE DESIGN TOOLS
https://servicedesigntools.org/
From the web site: "Service Design Tools is conceived as an open platform of knowledge, to be shared with the design research community."
SMITHSONIAN OPEN ACCESS - DOWNLOAD, SHARE AND REUSE MILLIONS OF THE SMITHSONIAN'S IMAGES
https://www.si.edu/openaccess
This looks like a great resource for creators and communicators. The Smithsonian has made available more than 4.5 million 2D and 3D digital items from their collections that anyone can share and reuse, right now, without asking. Take a look.
SOCIAL CHANGE ECOSYSTEM MAP
https://buildingmovement.org/our-work/movement-building/social-change-ecosystem-map/
From the website: "This is a framework that can help individuals, networks, and organizations align and get in right relationship with social change values, individual roles, and the broader ecosystem. Download the map, accompanying materials, and more from the website."
SOCIAL NETWORK ANALYSIS TOOLS - LIST INCLUDES FREE AND OPEN SOURCE
http://www.butleranalytics.com/20-free-and-open-source-social-network-analysis-software/
If you're interested in understanding groups and networks, this list of tools you might use can be valuable to you.
SOCIAL NETWORK MAPPING - NODEXL - TUTORIAL
https://mappingforjustice.blogspot.com/2015/09/mapping-social-media-networks-nodexl.html
This blog article includes links to various sites where you can learn how to use NodeXL, a free, open source tool, to map participation in social networks.
STANFORD UNIVERSITY DSCHOOL (DESIGN)
https://dschool.stanford.edu/field-notes
Browse the different sections of this web site to see all the ways the Stanford University dSchool "helps people unlock their creative potential and apply it to the world."
STRATEGY MAPPING - STRATEGIC COMMUNICATIONS
https://www.valuebasedmanagement.net/methods_strategy_maps_strategic_communication.html
This web site illustrates the value of using concept maps in communications of strategy.
STUDIO BOOMWEHMEYER - EXPLORES DIFFERENT PERSPECTIVES AROUND SOCIETY, CULTURE AND CRAFTSMANSHIP.
http://boomwehmeyer.com/
From the web site: "This website functions as archive for objects, making and academic processes. Working together with a variety of partners, academies and institutes studio BoomWehmeyer explores different perspectives around society, culture and craftsmanship. The studio work stems from an active mentality to work together on the expanding consciousness and roles of designers in today’s rapidly transforming, technological, social and cultural landscape. Many projects are grounded in research and maker-ship as core ingredient in their activities."
SYSTEMS THINKING AND VISUALIZATION TUTORIAL
http://systems.open.ac.uk/materials/T552/
From the web site :"The Systems Group at the Open University is committed to the study, application and development of systems ideas. We aim to help people make sense of -- and intervene in -- complex and interconnected situations. We work with a wide range of issues and settings including: environmental decision-making for sustainable development; information systems management; organisational change in both public and private sectors; and integrated waste management." This link points to examples of different kinds of systems maps that the Open University Systems Group has developed over the years. It's an interactive site that helps users explore the ways in which different kinds of 'diagramming' can be used in a systemic inquiry.
SYSTEMS THINKING TOOLS - A REFERENCE GUILD (PDF)
https://thesystemsthinker.com/systems-thinking-tools-a-users-reference-guide/
From the web site, "Whether you are new to systems thinking or merely need a guide to available tools, this collection introduces you to dynamic, structural, and computer-based tools – from stocks and flows to causal loop diagrams and management flight simulators."
UNDERSTANDING SOCIAL NETWORKS - VISUALIZING NETWORKS
https://cambridge-intelligence.com/use-cases/social-networks/?goback=.gde_1314427_member_5811084457679028224#!
From the web site: "Network dynamics dictate the spread of information, news and ideas. They can help identify someone’s tastes, opinions and activity. If we can understand a person’s network, we will have a much deeper knowledge of them than if we assessed them in isolation.
By studying a social network we can find influential people, anticipate peaks in demand for products or services, generate more targeted marketing approaches and predict illegal activity. On a more personal level, we can also build communities, identify vulnerable and isolated people and help people find new connections." Read the White Paper on this site.
UNDERSTANDING SOCIAL NETWORKS ON TWITTER
click here
This article talks about how social network analysis can help build an understanding of the different ways people group and interact on Twitter. For those working to draw people from social networks to a specific interest area, or a product/service, this offers a building block of understanding.
URBAN DESIGN COURSES ON RACE AND JUSTICE - NEEDED
click here
This CityLab article says "Black students at Harvard’s Graduate School of Design say there are no design courses that consider race and justice. Here’s an outline for one." Visit the site and use the ideas.
USING CMAPTOOLS TO CREATE CONCEPT MAPS
click here
This article, titled "Visual Connections for Museums" demonstrates uses of cMap Tools to create concept maps. Read the article and dig into the maps.
USING NETWORK ANALYSIS AND SOCIAL MEDIA FOR PLANNING & ANALYZING A CONFERENCE
click here
This article shows how network analysis, using #nodeXL, was used in planning a conference and in understanding participation after the event. This is one of many related and interesting articles on the #ScottPublicHealth blog.
USING NETWORK ANALYSIS TO UNDERSTAND GIT HUB NETWORK
https://sbaack.com/blog/scraping-the-global-civic-tech-community-on-github-part-2.html
This article not only provides an understanding of people/organizations who use the GitHub web site, but also demonstrates how this type of analysis might be applied to help build understanding of groups focusing on other social/economic/environmental and health issues in the world.
UX MAPPING METHODS COMPARED: A CHEAT SHEET
https://www.nngroup.com/articles/ux-mapping-cheat-sheet/
From the article: "Empathy maps, customer journey maps, experience maps, and service blueprints depict different processes and have different goals, yet they all build common ground within an organization." This article describes all four types of mapping, using visualizations to illustrate ideas.
VENSIM - SIMULATION SOFTWARE FOR IMPROVING THE PERFORMANCE OF REAL SYSTEMS.
https://vensim.com/
From the web site: "Vensim is used for constructing models of business, scientific, environmental, and social systems. Ventana Systems also provides strategic management consulting using dynamic simulation models." The site contains many articles and resources.
VISUAL COMPLEXITY - AGGREGATION OF NETWORKS
http://www.visualcomplexity.com/vc/about.cfm
From the web site: "VisualComplexity.com intends to be a unified resource space for anyone interested in the visualization of complex networks. The project's main goal is to leverage a critical understanding of different visualization methods, across a series of disciplines, as diverse as Biology, Social Networks or the World Wide Web." The goal is that "this space can inspire, motivate and enlighten any person doing research on this field."
VISUAL LANGUAGE AND ROBERT HORN
http://pictureitsolved.com/resources/principles/robert-horn-and-visual-language/
This article introduces Robert Horn, who, "In his most recent book, Visual Language: Global Communication for the 21st Century, Robert Horn defines visual language as the integration of words, images, and shapes into a single communication unit. " Follow the links and learn more.
VISUALLY RECORD A CONVERSATION
https://visualthinkery.com/project/visually-recording-a-conversation/
This article on the Visual Thinkery site provides steps for visually recording a conversation. It's part of the creative process ideas shared on the site.
VISUALIZATION METHODS - A TABLE OF CONTENTS
https://www.visual-literacy.org/periodic_table/periodic_table.html
This web site offers a comprehensive map of the various types of visualization methods with links to each example
VISUALIZATION MODELS - SUSTAINABILITY
https://computingforsustainability.com/2009/03/15/visualising-sustainability/
This 2009 site has collected over 280 graphics that visualize sustainability strategies. As you look to communicate ideas this provides numerous examples of ways to do this.
VISUALIZATION OF UNIVERSAL BASIC INFORMATION (UBI) INFORMATION
https://basicincome.stanford.edu/research/ubi-visualization/
At this link you will find an interactive concept map, using a format like KUMU, to show information related to Universal Basic Income (UBI). This uses a hub (UBI) and spoke (related information) design. Created by Stanford University Basic Income Lab.
Note: Tutor/Mentor Connection has been using concept maps since 2005 to visualize information in this library and seeks a university partner who will adopt the T/MC and rebuild this library using a format similar to what Stanford has done.
VISUALIZATION, COOL GRAPHICS - LIST OF WEB SITES
https://coolinfographics.com/links/
This web site provides an extensive list of other sites with great graphics and visualizations.
VISUALIZATIONS USED TO COMMUNICATE SDGS GOALS, STRATEGIES, CHALLENGES
https://www.glesi.org/
This site illustrates an effective use of visualization to communicate challenges to achieving the United Nation's Sustainable Global Development Goals by 2030. Finding talent to do work like this is a challenge for most NPOs and social entrepreneurs. Offering talent is a role many volunteers could take.
VIZDEX - A LIBRARY OF BLOGS DEDICATED TO DATA VISUALIZATION
https://vizdexproject.com/
This site has an extensive, and growing, collection of personal and independent blogs and newsletters dedicated to datavisualization. You can sort by several topics. Inspire your own work by learning from work done by others.
WE ALL COUNT - SEEKS TO INCREASE EQUITY IN DATA SCIENCE
https://weallcount.com/
From the website: "We All Count is committed to increasing data literacy -- and particularly data equity literacy for everyone. We make tools, write articles and foster communities that everyone can benefit from" If you're interested in the push for better equity in data science, you should take some time to browse through this site to see what it offers.
WEAVE THE PEOPLE - NETWORK BUILDING PLATFORM
https://weavethepeople.com/blog/
This looks like a powerful tool for helping build stronger and longer-lasting networks and for doing the network analysis and visualization needed to understand the networks you're building. Editor note: I've not used it myself so would like to hear from others who find this and use it.
WEBQUEST NEWS AND ACTIVITIES
http://webquest.org/
From the web site: "A WebQuest is an inquiry-oriented lesson format in which most or all the information that learners work with comes from the web. The model was developed by Bernie Dodge at San Diego State University in February, 1995 with early input from SDSU/Pacific Bell Fellow Tom March, the Educational Technology staff at San Diego Unified School District, and waves of participants each summer at the Teach the Teachers Consortium at The Thacher School in Ojai, California. This site is the most complete and current source of information about the WebQuest Model."